
The 6× Price Spread Across Dubai
Between the most and least expensive areas sits a gap wide enough that a citywide average describes almost nobody.
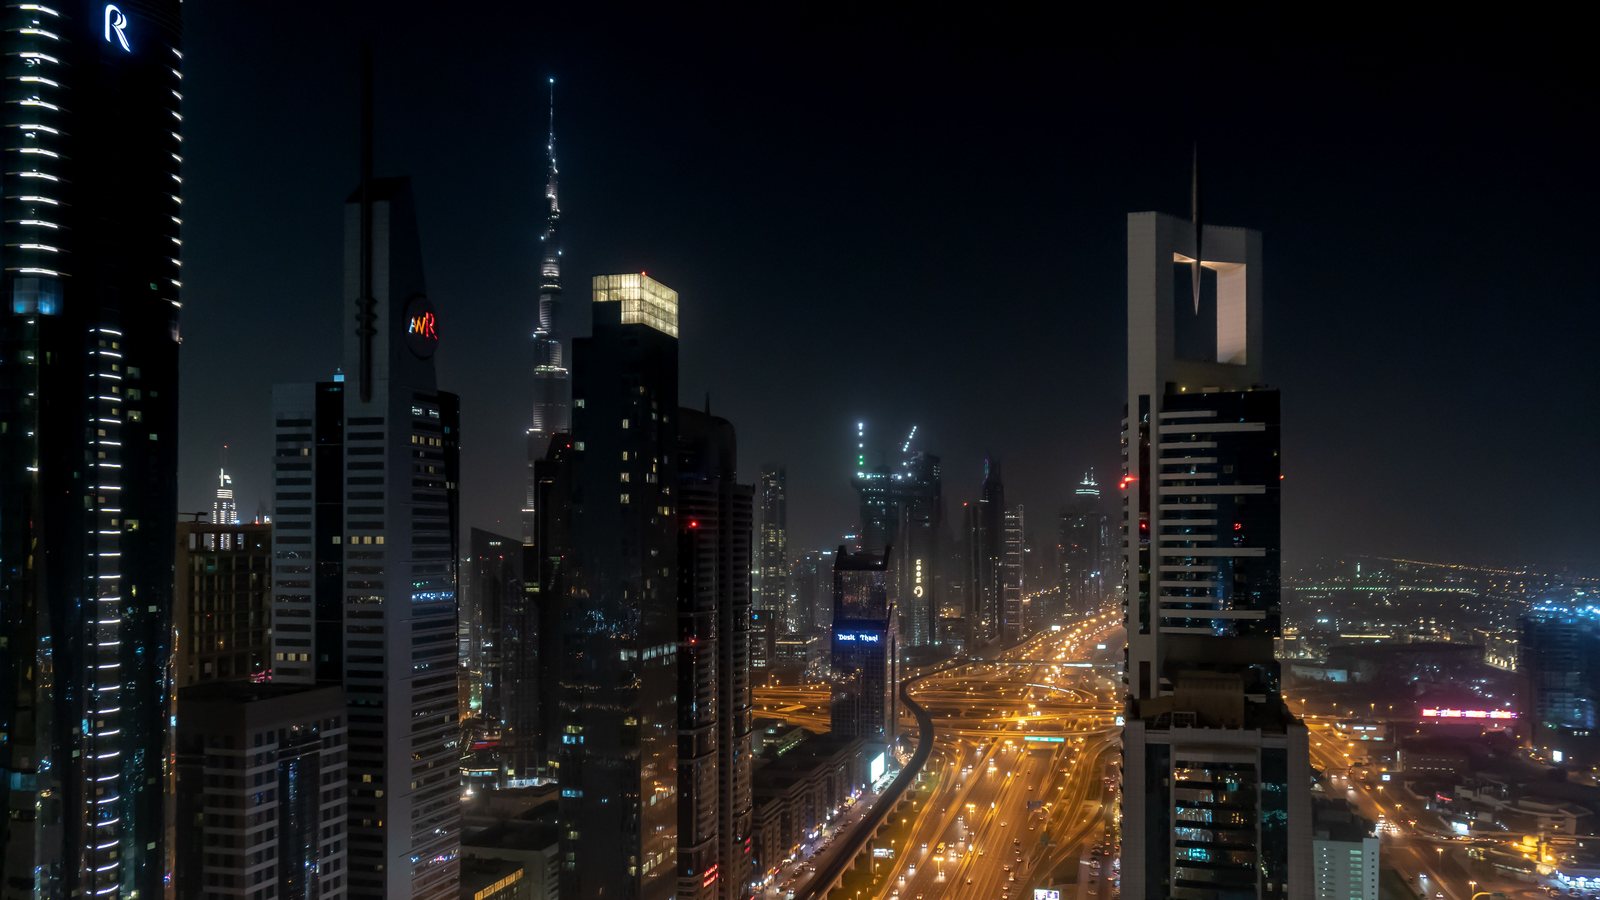
Dubai is not one property market. Between its most and least expensive areas sits a 6.5× gap in price per square foot.
Trade Center Second carries a median of AED 4,834 per square foot. International City Ph 1 sits at AED 739. Both are Dubai; both are within an hour's drive of each other.
Why a citywide average misleads
The Dubai median of AED 1,743 describes almost nobody's actual purchase. It is a useful reference for measuring one area against another and a poor basis for any decision on its own.
| Most expensive | AED / sqft |
|---|---|
| Trade Center Second | 4,834 |
| Marsa Dubai | 4,480 |
| Tecom Site A | 4,064 |
| Trade Center First | 3,669 |
| Dubai Harbour | 3,574 |
| Business Park | 3,560 |
| Palm Jumeirah | 3,531 |
| Palm Jabal Ali | 3,488 |
| Most affordable | AED / sqft |
|---|---|
| International City Ph 1 | 739 |
| Remraam | 962 |
| Discovery Gardens | 986 |
| Liwan | 1,094 |
| Silicon Oasis | 1,149 |
| International City Ph 2 & 3 | 1,150 |
| Dubai Investment Park First | 1,168 |
| Madinat Hind 4 | 1,169 |
Read it by area
Every figure on this site is reported per area for this reason. 90 areas are published; 177 more exist in the data but had too few sales to report responsibly.
More in Market analysis
Seven months of official transactions, read area by area — which parts of the city carry the premium, which carry the volume, and what the spread between them shows.
ReadMost Dubai sales in the period were off-plan, but the split varies enormously by area — from near-total in new districts to barely half in the established ones.
ReadTen areas account for most of Dubai's recorded sales. Transaction activity is far more concentrated than the map suggests.
Read