
Dubai Development Pipeline 2026–2030: Supply Outlook by Area
Dubai's residential delivery pipeline to 2030 — where supply concentrates, historical slippage rates, absorption capacity, and which areas face the most competition.
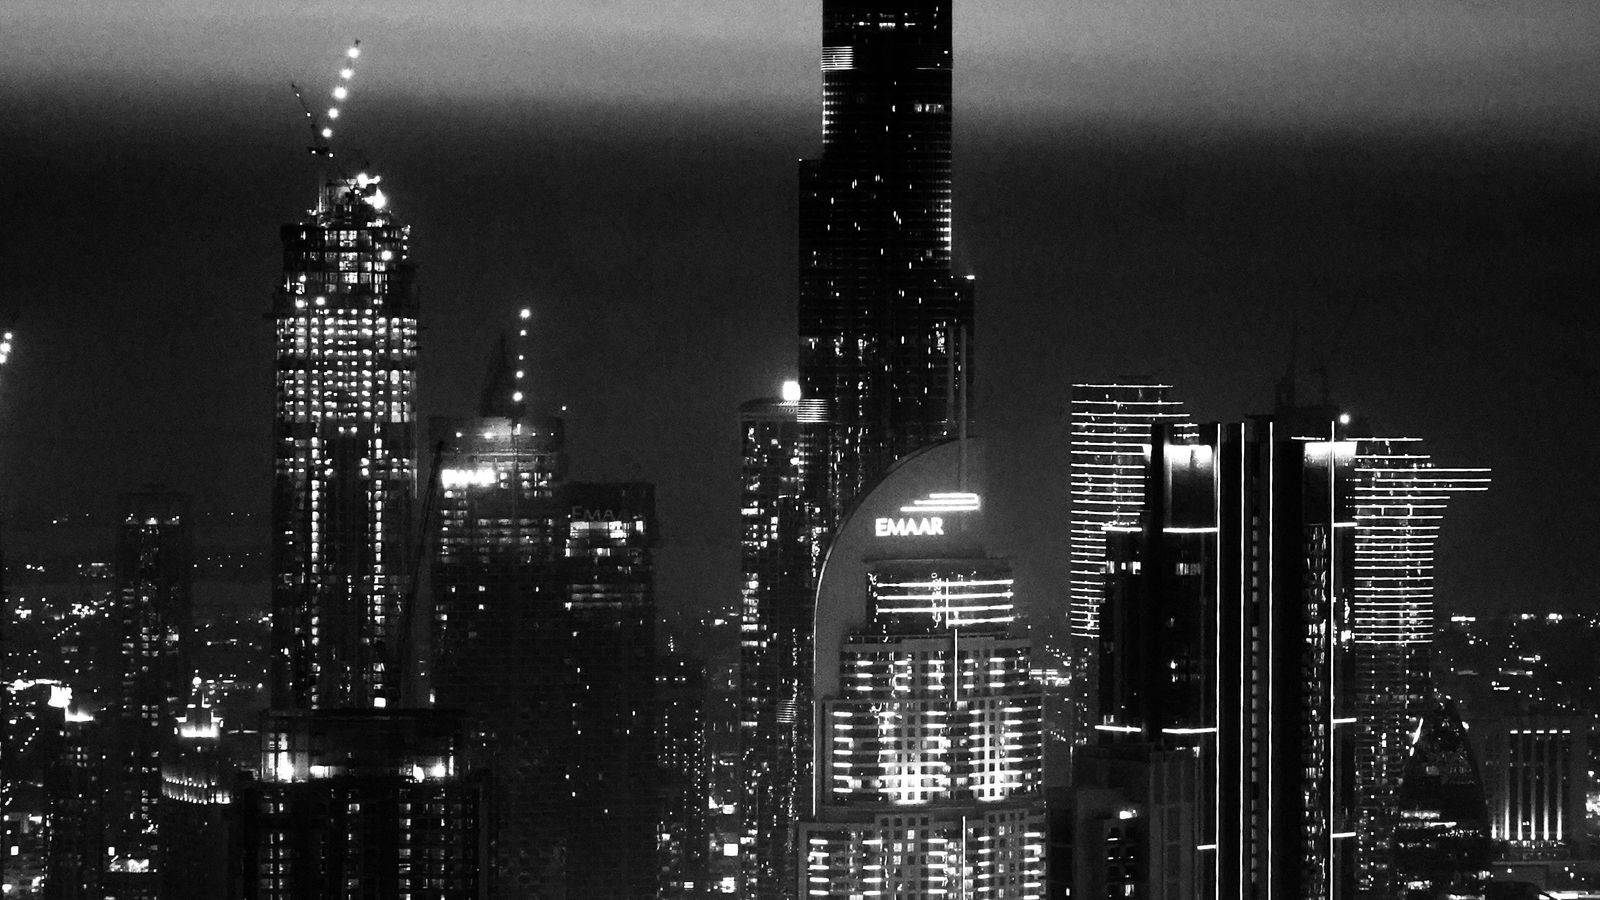
The supply schedule is the most useful and least-read document in Dubai property. It is published, it is boring, and it predicts more than any forecast.
Why the pipeline matters more than the forecast
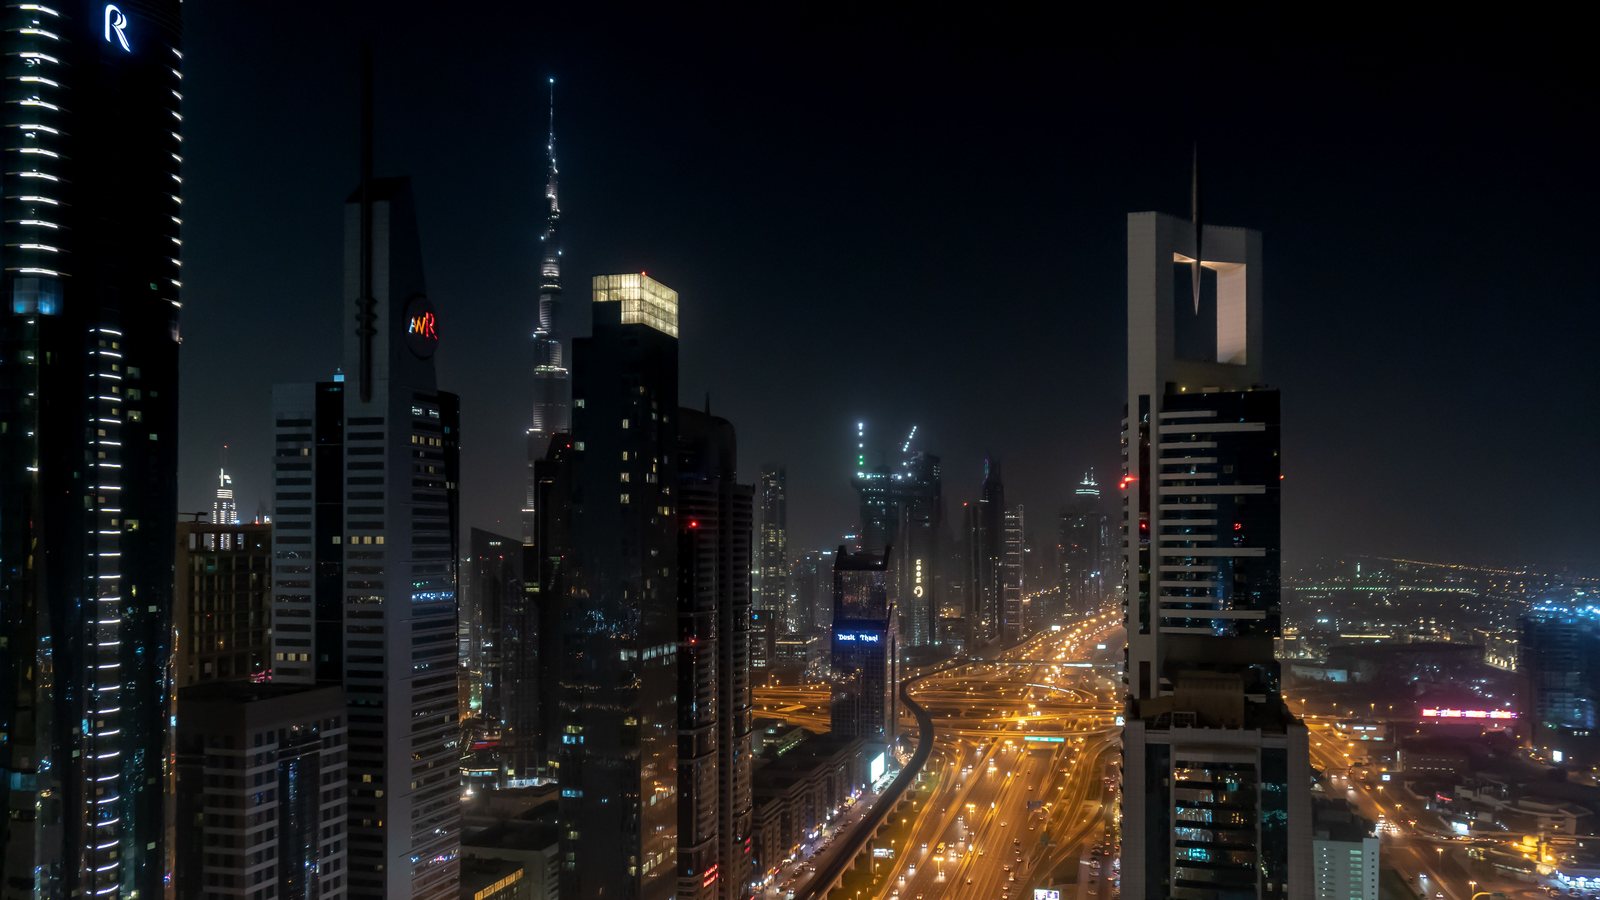
Dubai's downturns have been supply events. Prices fell after 2008 because units launched in 2006–07 arrived into a collapsed market. Prices ground lower from 2015 to 2020 because units launched in 2013–14 landed alongside a transfer-fee increase and oil weakness.
In both cases the supply that caused the damage was scheduled and visible years in advance.
Demand is volatile and hard to forecast. Supply is largely determined three years ahead. That asymmetry is the individual investor's single best analytical edge.
The scale of the 2026–2030 pipeline
Dubai's announced residential delivery across the 2026–2030 window runs to tens of thousands of units annually — substantially above the emirate's long-run historical average, and driven by the launch surge of 2021–2024.
Critical adjustment: announced completions do not arrive as scheduled. Historical slippage runs at roughly 30–40% in any given year, as developers phase delivery in response to market conditions.
This slippage is the market's principal self-correcting mechanism and a genuine structural improvement on 2007, when developers built regardless. It also means published pipeline figures overstate near-term supply while understating the cumulative overhang that eventually lands.
Working assumption: actual annual delivery in the 2026–2028 window is likely to run at roughly 60–70% of announced figures.
Where supply concentrates
| Area | Supply intensity | Profile |
|---|---|---|
| Jumeirah Village Circle / Triangle | Very high | High-density apartments, many small developers |
| Dubailand and sub-communities | Very high | Broad, mixed, dispersed |
| Dubai South | High | Infrastructure-led, long-horizon |
| Meydan / MBR City | High | Mid-to-premium, large plots |
| Business Bay | High | Central towers, persistent supply |
| Arjan / Dubai Science Park | High | Mid-market apartments |
| Dubai Creek Harbour | High | Emaar waterfront, large programme |
| Al Furjan | Moderate-high | Mid-market, maturing |
| Dubai Islands | High | New waterfront programme |
| Dubai Hills Estate | Moderate | Master community, phased |
| Damac Lagoons / Hills 2 | High | Large villa/townhouse communities |
| Palm Jumeirah | Very low | Physically constrained |
| Emirates Hills, Jumeirah, Jumeirah Bay | Very low | Essentially fixed |
| Established villa communities | Low | Limited new comparable stock |
The pattern is the whole story. Supply concentrates where land is available and demand is price-sensitive. It is absent where land is finished and demand is not.
That is precisely why Emirates Hills villas grew 11.33% and Jumeirah villas 10.31% in Q1 2026, while high-supply apartment clusters delivered excellent yields and modest capital growth.
The absorption question
Demand side: Dubai's population growth of roughly 100,000+ residents annually, at expatriate household sizes of 2.5–3, implies demand for approximately 35,000–45,000 additional dwellings per year.
Supply side: announced pipeline above that range in several years; actual delivery, after slippage, closer to it.
The system has been roughly in balance, with slippage doing the balancing.
The risk scenario is a year in which slippage is low — projects complete on schedule — while migration softens. That combination has produced every Dubai rental correction of the last twenty years.
Early warning signs: rental growth decelerating (Dubai rents grew about 6.2% annually as at December 2025, falling to roughly 1.5% by April 2026 — apartments +2.1%, villas −1.5%); rising rental listing counts in specific buildings; and lengthening days-on-market in the ready sale market.
The April 2026 rental data was already showing that deceleration.
Infrastructure catalysts
Supply is not the only scheduled variable. Confirmed infrastructure changes location values on a timetable you can plan around.
Al Maktoum International Airport expansion. A very large long-term programme that underpins the Dubai South thesis. Long horizon — this is a decade-plus investment case, not a three-year one.
Metro network extensions. Route expansions materially change accessibility and therefore rent in affected communities. Confirmed and funded extensions matter; announced ones do not, until funded.
Dubai Islands. Nakheel's substantial waterfront programme, adding significant new coastal supply.
Dubai median price per square foot
Computed from every recorded DLD sale, 1 Jan 2026 to 31 Jul 2026.
Road network upgrades. Ongoing improvements across the emirate affecting commute times, which are a primary driver of tenant location choice.
The discipline: distinguish confirmed, funded, under-construction infrastructure from announced intentions. Dubai has delivered enormous infrastructure, and it has also announced projects that did not proceed on the original timeline. Price only what is being built.
How to use the pipeline in a purchase decision
One question, before any offer:
"How many directly comparable units are scheduled to complete within two kilometres in the next thirty-six months?"
If the answer is large, you are a price-taker on both rent and resale. That is acceptable — but you should be compensated for it in yield today, not promised compensation in appreciation later.
If the answer is small, you have pricing power. That justifies a lower yield.
How to find the answer:
- DXB Interact — off-plan transaction volumes by area indicate what is under contract and therefore coming.
- Developer project listings for the area, with announced handover dates.
- DLD project registration data.
- Consultancy research — CBRE, JLL, Knight Frank, ValuStrat and Cavendish Maxwell publish quarterly supply outlooks, generally free.
- Satellite imagery. Google Earth's historical view shows what is actually under construction around a site, which is more reliable than any announcement.
That last one is under-used and unusually effective. Renders show a finished tower against an empty skyline. Satellite imagery shows the four cranes 400 metres away.
The strategic conclusion
Dubai in 2026 was not one market. It was:
A supply-constrained prime and villa segment with genuine pricing power, strong capital growth and low yields.
A high-supply mid-market apartment segment with excellent gross yields, limited pricing power and heavy forward competition.
Both are legitimate investments. The error is buying the second while expecting the returns of the first — which is exactly what launch marketing in high-supply clusters invites you to do.
Before you buy anything off-plan in Dubai between now and 2028, look at the supply schedule for the two kilometres around it. It is free, it takes twenty minutes, and it is the closest thing to foresight available in this market.
Common questions
How many units is Dubai delivering per year?
Announced pipeline runs to tens of thousands annually through 2026–2030; actual delivery historically lands at roughly 60–70% of announced.
Is Dubai heading for oversupply?
Not uniformly. Prime and villa segments are supply-constrained; several high-density apartment clusters face heavy delivery through 2028.
Which areas have the most supply coming?
JVC/JVT, Dubailand, Dubai South, Meydan/MBR City, Business Bay, Arjan, Dubai Creek Harbour and Dubai Islands.
Which areas have the least?
Palm Jumeirah, Emirates Hills, Jumeirah, Jumeirah Bay and established villa communities — all physically constrained.
How do I check supply near a property?
DXB Interact off-plan volumes, developer project listings, DLD registrations, consultancy supply reports, and satellite imagery.
Before you rely on this
Informational only. Pipeline figures are estimates; verify against current DLD and consultancy data.
More in Developers
The developer behind Burj Khalifa and Downtown — and why its launch pricing anchors whole districts for years.
ReadBranded residences, an early move into crypto payments, and what to check before buying off-plan from them.
ReadThe developer that manufactures beachfront. Palm Jumeirah, Palm Jebel Ali, and what waterfront scarcity does to price.
Read